Jan 20, 2023
Independent Report: SupportLogic Support Experience Management
Growth Marketing Manager, SupportLogic
customer sentimentAI for supportmachine learningNLP
Download Datasheet

Ryan Radcliff
Director of Product Marketing, SupportLogicIn the last year, efficiency has become vital to running customer support and preserving customer relationships. The average duration of complex support cases is a good indicator of overall support operations health.
For our customers, sentiment detection and automated workflows played key roles in their ability to resolve more cases faster with the same headcount. This article backs up that finding data from across our user base.
We’ll dive into statistics, look at the most detected sentiment signals, and see how case resolution times were impacted. As case durations increase, it can indicate one or more of the following:
In 2022, users spent 1.1 million total minutes in SupportLogic. That’s 428,000 more minutes than the previous year – a 62% increase (as reported in our fiscal year recap).
Our users also experienced 103M customer interactions – a 98% increase over last year. From these interactions, 11.6M customer sentiment signals were extracted – an increase of 118% over the previous year.
Looking across our users and 100% of their cases, the data showed us that despite flatter hiring and an increase in case volume, teams resolved cases faster. Support teams took on more cases with the same resources – proving what’s possible with the right tools and processes. Let’s dive into the data to back this up:
The charts below slice total case volume into four buckets – from the fastest resolving cases (the youngest cases, the 25% bucket) to the slowest (oldest cases, the 90% bucket). In these charts, you can see average case age decreasing across every case age group. Looking at the median groups (25th, 50th, and 75th percentiles) helps us isolate the oldest cases (the 90th percentile of cases).
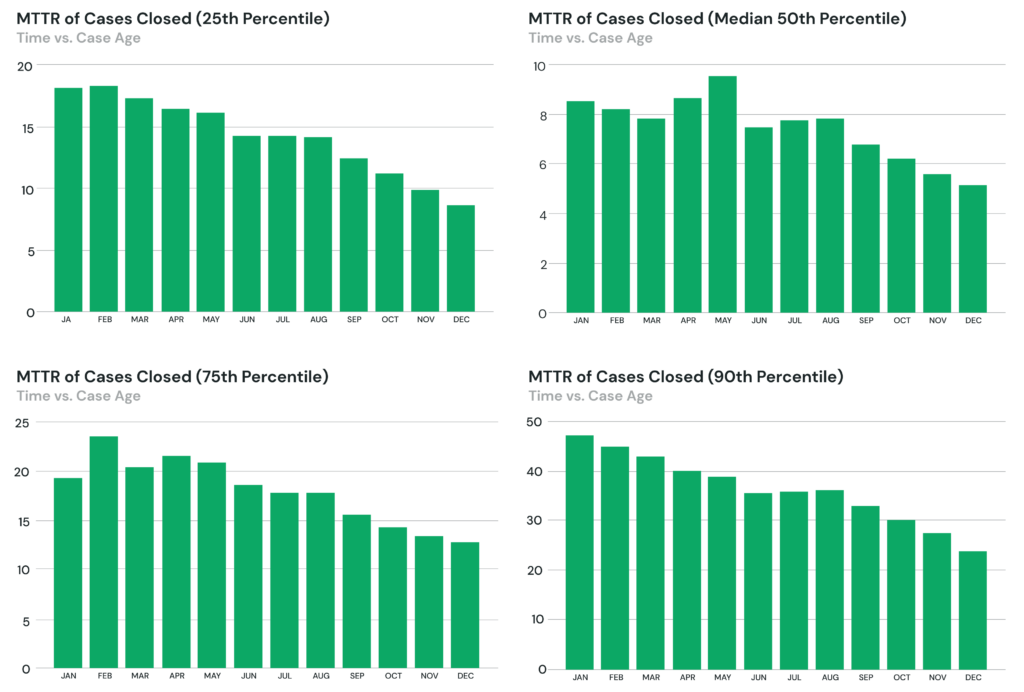
From this data we can see the following:
Noting these conclusions, let’s look at the following chart, which shows five buckets of case age compared to each other as pieces of total of case volume:
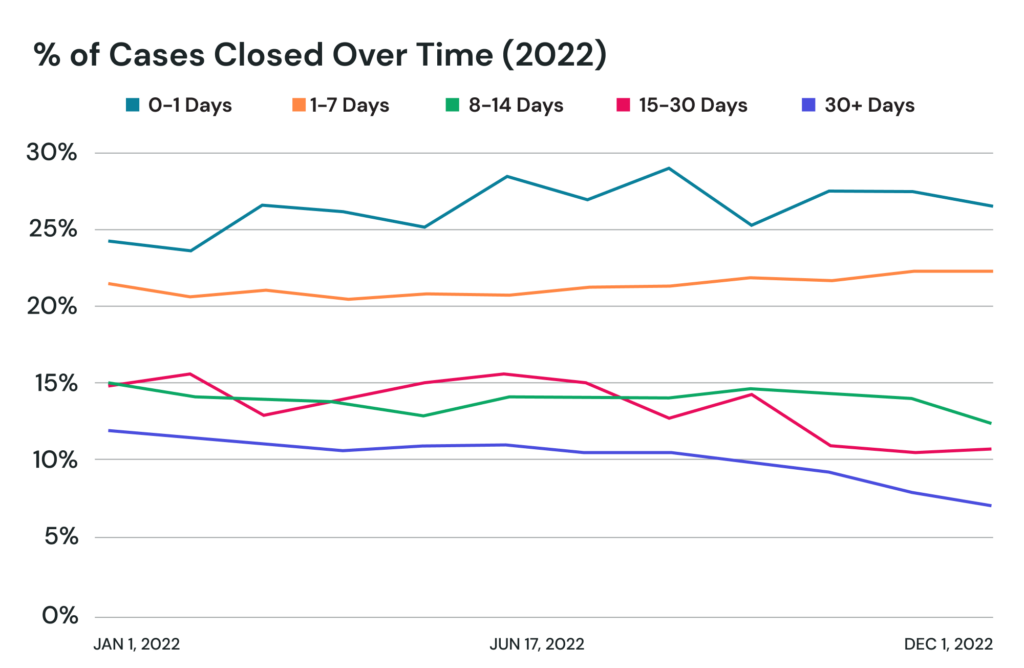
In this chart, you can easily see the spike in cases resolved “faster” over the summer, while the percentage of cases in the “15 to 30 day” age range swapped volumes with the cases resolved in the 14-day window. This supports our theory that the increase in case volume over the summer pushed backlogged cases out longer.
Toward the of the year, you can see younger cases taking a greater share of the total case volume. To support this, “older” cases dramatically decreased in share of total case volume. What does this mean? It supports our conclusions from above that more cases are getting resolved faster.
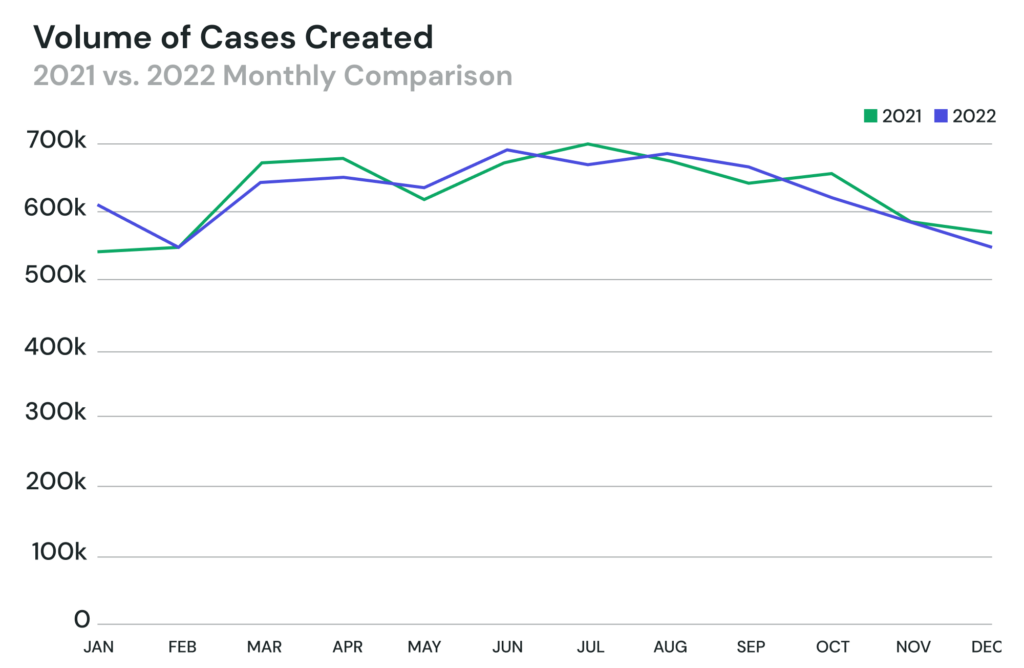
This next chart confirms the case spikes we saw in the summer months. What’s more interesting is this summer case spike holds over 2022 and 2021:
More cases are getting resolved faster – but how? Does this mean that teams added resources? Did cases get simpler? Likely not, as case deflection tools and chatbots are becoming a more prevalent part of many support organizations. For answers, let’s look at the count of unique users in our system to see if resources were added to take on this rise in caseload.
The final piece of this story looks at the resources used to solve complex support cases – the support engineers. When we look at user count, we actually see a flattening compared to the previous year.
The chart below shows the count of unique engineers working on cases through a 12-month period. Comparing 2021 to 2022, you can see customer support hiring increasing through 2021 but flattening in 2022, aligning with market trends and hiring freezes.
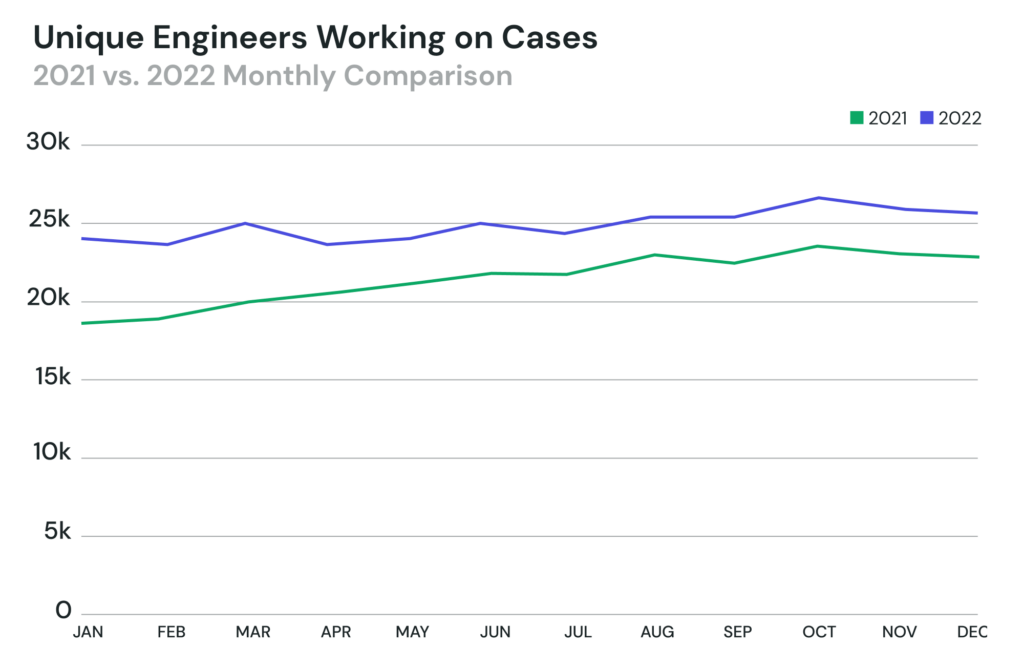
Comparing this chart to the case volume trends above, it’s interesting to see how agent count did not increase to meet the volume of cases resolved in 2022 the way it did in 2021 – and yet cases still closed faster.
Taking these three data points – case age, case volume, and support resources, respectively – a picture of increased efficiency starts to come into focus. These teams are handling more work with the same resources.
Shifting gears, let’s look at trends in the customer sentiment signals extracted from support cases. What are customer sentiment signals? We define them as the discovery and measurement of how customers feel about your product, brand, or service.
Natural language processing applies labels to words and phrases that are mapped to sentiment types. Signals and sentiments are then analyzed by machine learning models to tell you how a customer is feeling without having to read and monitor every case.
While over 40 signal types are labeled inside the conversations between users and their customers, below are the top 5 sentiment types out of the 11.6M signals extracted in 2022. We separated the sentiment stats by case volume, to show how SMB customers see slightly different results:
Top 5 detected customer sentiments:
For organizations with under 100k in case volume, “Production Issue” came in 6th – showing how growing organizations are leaning on customer feedback to pinpoint product issues.
From this data, we can see that users are likely using customer sentiment to close cases faster – using the follow-up, close request, call request, and urgency signals to spot cases that require attention. These signals are also searchable – pushing the corresponding cases up in the queue and helping teams resolve issues quickly so more focus can be spent on larger issues or reducing backlog.
In closing, looking at the data above adds up to some clear conclusions: support teams are solving more cases faster with the same resources – proving that automation and sentiment detection can have a tangible effect on customer support efficiency.
When you combine these findings with the improvements SupportLogic customers like Salesforce, Zywave, and Coveo see in their escalation rates, customer churn, and agent coaching, the benefits of Support Experience become even more clear.
To see how SupportLogic can help your organization, reach out to an expert or jump into one of our self-guided product tours.
Want the latest B2B Support, AI and ML blogs delivered straight to your inbox?