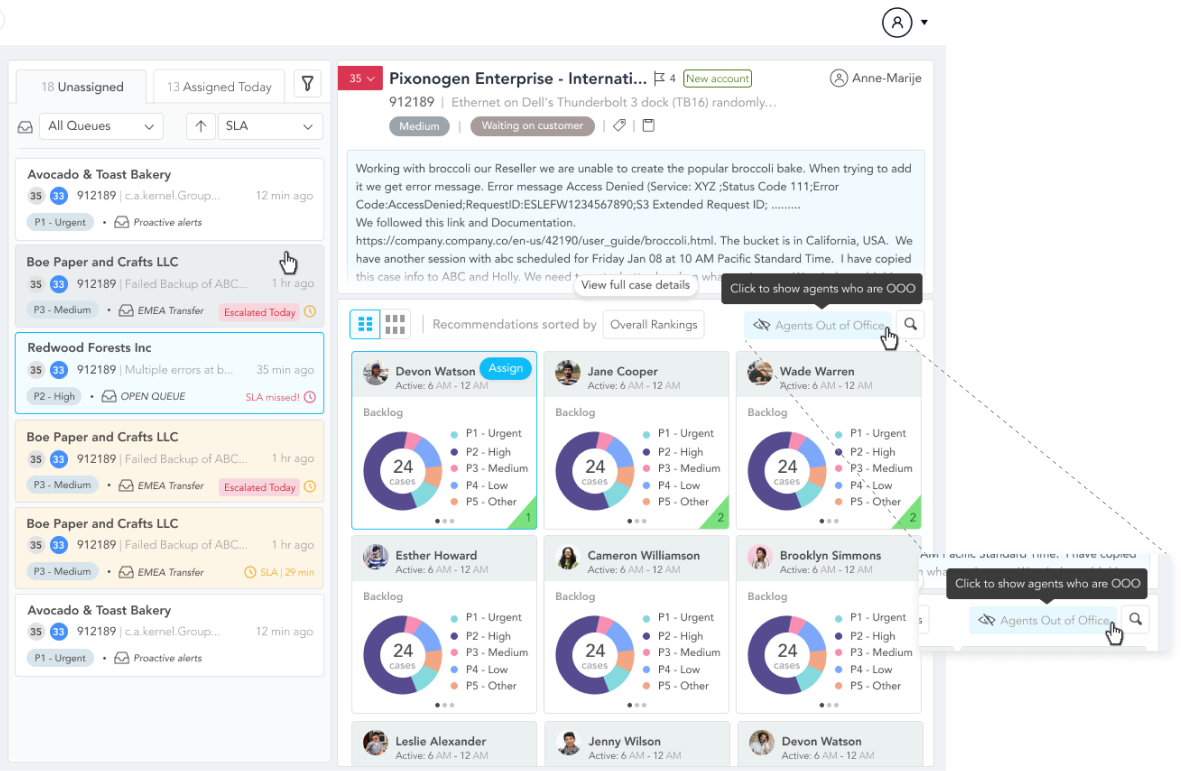
SupportLogic 4.9 Release Notes

March 2021

This release is setting up for all kinds of fun features that SupportLogic will be releasing to all our customers over the weeks and months to come.  We are offering beta versions of two exciting features that we have designed in conjunction with a couple of our key customers.   Read on to find out what these features are about – and reach out to your SupportLogic customer account representative to participate in the beta program.

  • NEW functionality: Case Evaluation (Beta)
  • NEW functionality: Personalizable Dashboards (Beta)
  • Data on the Topics page now represented as a box chart
  • Agents can see a summary of their customers’ sentiment

Heads-up: SupportLogic is going to get a face-lift in about 2 weeks and we wanted to give you a preview into our new look.   Based on your feedback, we re-organized the navigation menus on the left to be better aligned with the way you work.  Take a look at what will be changing so that you can have a seamless transition when the changes are rolled out soon.  

If you have questions or comments on these changes or any thoughts on future improvements you’d like to see, we would love to hear from you; send us an email at hello@supportlogic.io

Thanks
The SupportLogic Team

Case Evaluation

Evaluate cases to ensure alignment with company’s best practices

Every company defines their own best practices on how they want their support engineers to work with customers – professionalism, responsiveness, processes for closing out cases.  SupportLogic’s Case Evaluation module helps managers identify cases that merit review (not just the bad ones, but the good ones too) to be able to provide timely and relevant feedback to their team members.
In order to do this, one of the first steps is to be able to classify the various interactions between a customer and the engineer in a case – such as the greeting, a customer request, agent request for logs, case closure handshake.   So in this first beta release of this feature, our NLP model will identify and label these interaction types so that managers can ensure that the cases are well documented by the engineers.  This is also an opportunity for you to give feedback to our model on interactions that we may have missed which would help train the model in the future.

My Dashboard

Create a personalized dashboard to get a snapshot of your team

SupportLogic is rolling out the ability for users to create a personalized dashboard – a bird’s eye-view of the most important KPIs and cases that you care about.  In this beta, the focus is on dashboards for line managers who manage a team. As soon as you set up a dashboard, we will initialize it with a few case lists and key metrics.  You can keep those (or not), and add any other lists and charts that you want to monitor on a daily basis.

This is just the first step towards making this dashboard the place where many of you are going to spend a lot of your time.  Future releases will allow a manager to have multiple teams, each with their own customized dashboard, as well as dashboards for other roles like an escalations manager or a queue manager.

Data on the Topics page now represented as a box plot

Find outliers more easily

The data on the Topics page is now visualized as a box plot rather than a scatter plot.  Get a clearer picture of what your data distribution looks like and identify the outlier cases easily.  Click on the boxes to see the list of cases that each of them represents; or click on any of the dots each of which represents an outlier case to see the case details.

Agents can see a summary of their customers’ sentiment

Get a bird’s eye-view of the sentiments in each of your open cases

Managers loved this view in the Agents Management section so much, that we have made it available to agents as well.

In this one, compact view, agents can see how their cases are distributed by case priority, inactivity, ticket age or SupportLogic status. Click on the 3 dots at the top right of the table to configure what field values you would like to organize your backlog along. Each case is denoted by a square whose color denotes the sentiment of that case.

COMING SOON: New Navigation

Heads up on the new navigation coming in a couple of weeks

You will see a new navigation experience coming to the SupportLogic UI and we wanted to give you a sneak peak into what it will look like.   Rather than organize the menu by the modules that we sell, we grouped them the way you are using them.  Some of the page names have changed to better describe what they do.

  • Trends page is renamed Keywords and Trends
  • The Topics page is now called Patterns and Outliers
  • Case Assignment and Escalations are part of the Operations section

Click on the image on the right to zoom in.