Blog
How to Use Zendesk with SupportLogic to Deliver Proactive Support
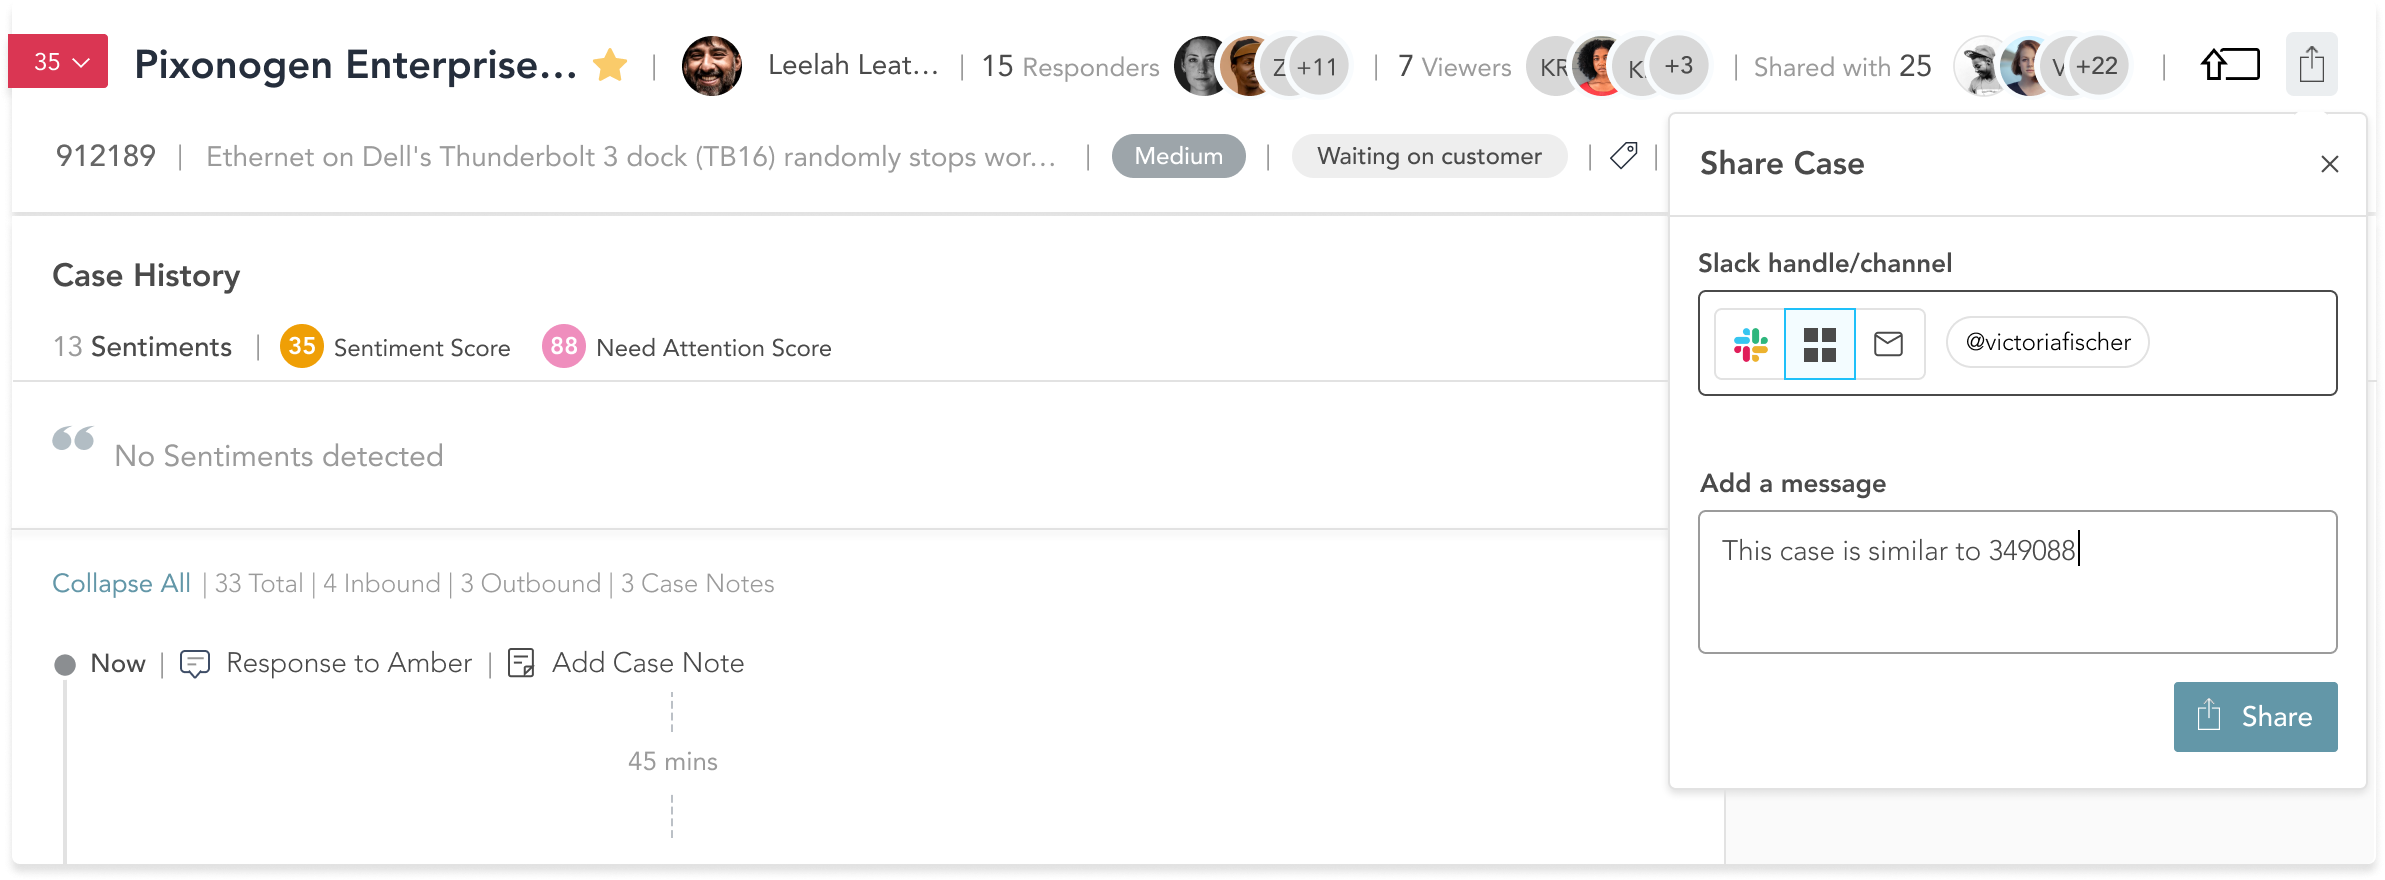
SupportLogic extracts data from every single Zendesk support interaction and transforms it into actionable intelligence. Read on to learn how to use Zendesk with SupportLogic SX to deliver proactive customer support at scale.
Read More
